
Citizen observatories and communities collect valuable environmental data — but making sense of this data can be tricky, especially if you're not a data expert. That’s why we created TAPIS: a free, easy-to-use web tool developed within the CitiObs project to help you view, manage, and analyze data collected from sensors and online platforms.
Why We Built TAPIS
The SensorThings API is a standard for sharing sensor data, used by many observatories. However, tools that help people explore this data visually and interactively have been limited. Often, users had to dig into complicated URLs and query parameters such as “expand”, “select”, “orderby” and “filter” to extract the data they needed, as illustrated in tutorials and examples such as the ones collected by SensorUp [1].
TAPIS changes that. It gives you a visual interface to work with sensor data from different API standards (such as SensorThings API, STAplus, OGC API Features/Records, OGC Catalogue Service for the Web, S3 Services, Eclipse Data Connectors, and STAC) and data file formats (such as CSV, JSON, JSON-LD, GeoJSON, and GeoPackage). You can load the data into tables, filter or group it, and view it as maps, bar charts, pie charts, or scatter plots — all in your browser, with no installation required.
Key Features
- Connects to online data sources (like OGC APIs, STAC, SensorThings, and CSV files)
- Turns raw data into easy-to-read tables
- Adds meaning to table columns
- Visualizes data with different chart types
- Links with MiraMon to create interactive maps
TAPIS is inspired by the look and feel of Orange Data Mining (a popular data science tool) — but runs entirely in your browser, making it accessible for all users, even those with limited technical skills.
Example Use Cases
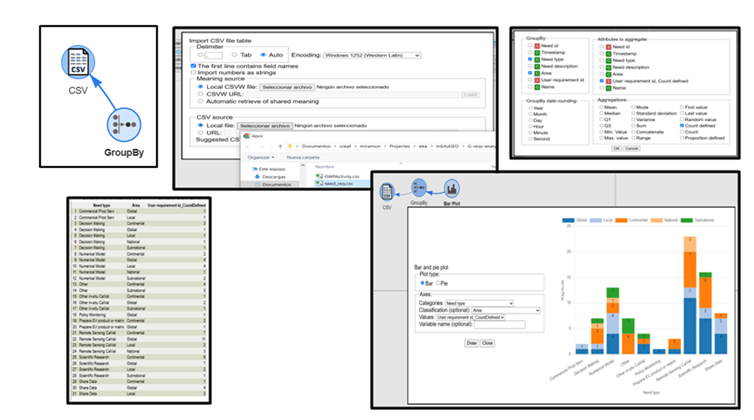
One example illustrates how to create a stacked bar chart plot by grouping values from two columns in a CSV file. The values of the first column in the table are displayed as the bar titles and the values of the second criteria as the colors of the stacked fragments of each bar.
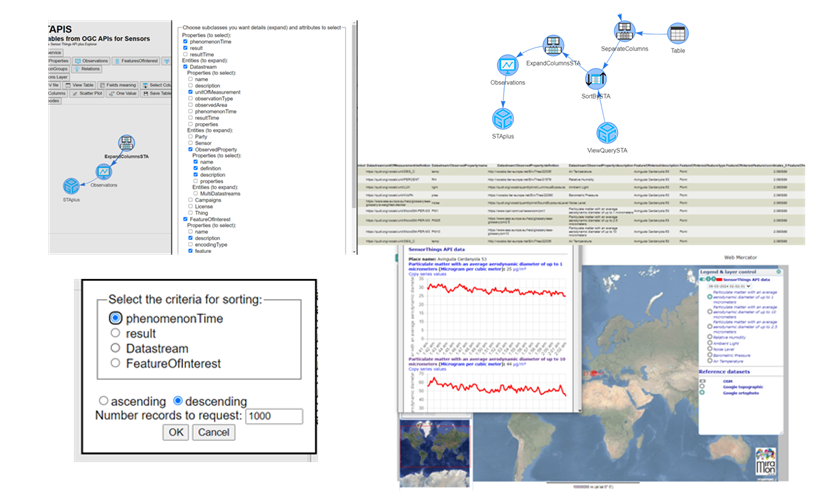
Another example shows how TAPIS connects to the MiraMon Map Browser to display a map of features from the SensorThings API, including their latest observations. The tool to generate the map is capable of sorting the data by feature of interest and observed property before sending the data to the browser to be represented as a map.
How TAPIS Supports CitiObs
TAPIS is part of the CitiObs environmental toolkit, supporting Citizen Observatories in working with their own environmental data. It’s designed to help communities explore, trust, and act on the information they collect — from air quality to noise pollution and beyond.
As we roll out the CitiObs Knowledge Platform, TAPIS will be available to all partner observatories as a core tool for data access and analysis.
Try TAPIS
- Learn more: TAPIS Help Page
- Contribute or report issues: TAPIS GitHub
- Explore CitiObs tools: CitiObs GitHub
[1] SensorUp tutorial https://developers.sensorup.com/docs/#queryparameters

